caption
Pressure Mapping SystemsSensor Technology
At the heart of every Pressure Measurement System is an extremely thin (~0.1 mm), flexible tactile force sensor. Sensors come in both grid-based and single load cell configurations, and are available in a wide range of shapes, sizes and spatial resolutions (sensor spacing).
These sensors are capable of measuring pressures ranging from 0-15 kPa to 0-175 MPa. Each application requires an optimal match between the dimensional characteristics of the object(s) to be tested and the spatial resolution and pressure range.
Sensing locations within a matrix can be as small as .0009 square inches (.140 mm2); therefore, a one square centimeter area can contain an array of 170 of these locations.
Sensors have been created covering 256 square inches (1600 square centimeters) with over 100,000 sensing locations.
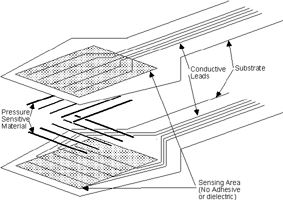
The Virtual System Architecture (VSA) allows the user to integrate several sensors into a uniform whole. The areas covered using this method can be significant. The pressure or force information derived from the sensor array is seamlessly displayed on your computer screen. The standard sensor consists of two thin, flexible polyester sheets which have electrically conductive electrodes deposited in varying patterns. In a simplified example below, the inside surface of one sheet forms a row pattern while the inner surface of the other employs a column pattern. The spacing between the rows and columns varies according to sensor application and can be as small as ~0.5 mm.
Before assembly, a patented, thin semi-conductive coating (ink) is applied as an intermediate layer between the electrical contacts (rows and columns). This ink provides the electrical resistance change at each of the intersecting points.
When the two polyester sheets are placed on top of each other, a grid pattern is formed, creating a sensing location at each intersection. By measuring the changes in current flow at each intersection point, the applied force distribution pattern can be measured and displayed on the computer screen.
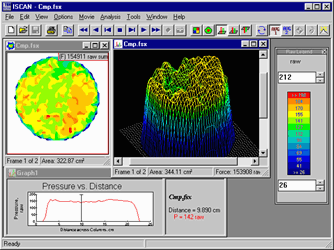
With the this system, force measurements can be made either statically or dynamically and the information can be seen as graphically informative 2-D or 3-D displays. In use, the sensor is installed between two mating surfaces. The matrix-based systems provide an array of force sensitive cells that enable you to measure the pressure distribution between the two surfaces.
The 2-D and 3-D displays show the location and magnitude of the forces exerted on the surface of the sensor at each sensing location. Force and pressure changes can be observed, measured, recorded, and analyzed throughout the test, providing a powerful engineering tool.
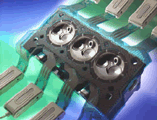
Cylinder head gasket application (2D and 3D views)
Data Acquisition, Display, and Analysis Software
The products function in both static and dynamic measurement environments. Our customers are interested in the temporal development of load profiles and peak load attainment, as well as the relaxation characteristics of materials. Each system is capable of sampling thousands of sensors per second; our standard I-Scan system can sample 250,000 sensors per second.Custom-manufactured systems are available which sample 100,000 sensors at 500 Hz - an astounding 50,000,000 sensors per second!
High-speed systems are simplified matrices or single load cell configurations. The current maximum sampling rate for an integrated system is 10 kHz in a 44 load cell configuration (cost of the 44 load cells? Under $500.00 US). This high sampling rate is possible due to the extreme thinness and the relatively high spring constant of our sensor materials (a rise time of less than 20 microseconds). The ability to directly instrument the impact surface greatly enhances overall test accuracy.
No other system solution is as adaptable and affordable. Making this possible is Tekscan's custom data acquisition hardware and software. The data acquisition software consists of low level sampling control, sensitivity adjustment, and signal processing.
This software optimizes the performance of the system in the acquisition of force or pressure data from our matrix-based and FlexiForce sensors.With its Windows™-compatible software, the Tekscan system is simple to operate. Whether you choose a standard or a custom package, your system will respond quickly to your most important and frequent needs with graphically informative displays and intuitive operations.
Application in Chemical Mechanical Polishing.
Real time 2-D color displays and 3-D wire frames have visual impact, simplicity and clarity that are applauded by our customers worldwide. The software enables the user to view a cross-sectional presentation, locate areas of interest, and display temporal, force, and pressure characteristics on-screen.
Various plots of Force, Pressure, and Time are available. Basic mathematical operations, such as peak pressure distribution, average, minimum, maximum, center of force, and many more, are also available.
For those that want to use more sophisticated data analysis tools, such as MatLab or Excel, an easy-to-use ASCII transfer function is available. Each system has basic analysis features tailored to its application. Additional features can be added from a menu of choices.
Data Acquisition Hardware
Available are a variety of data acquisition interfaces ranging from the simple serial to more complex parallel and ISA interface boards. Each product embodies sophisticated microprocessor based circuitry to control scanning, adjust sensitivity and optimize the performance of our grid-based and FlexiForce™ products.
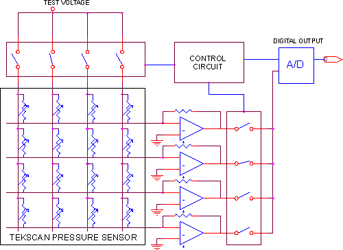
Simplified electronics schematic.
The diagram illustrates the sensing system and a simplified electrical schematic of the 8-bit electronics, which scans the intersecting points of the sensor's rows and columns and measures the resistance at each contact point. These points are read in the presence of multiple contacts, while simultaneously limiting the possible current flow through the device.
Each contact location is represented by a variable resistor whose value is high when no force is applied to it. The Tekscan sensing system is controlled using a personal computer and software.
The sensor is read sequentially by driving one of the rows and sensing one of the columns. The microprocessor selects the row and column to be read by identifying the proper address for each intersecting row and column.
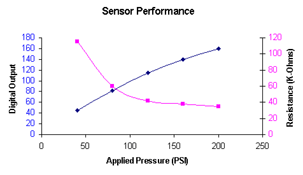
Sensor Performance Summary
Our patented grid sensor technology has played a key role in research and development in numerous applications all over the world.
For details of Sensors Suppliers, click here...
        Home - Website - Search - Suppliers - Links - New Products - Catalogues - Magazines
Problem Page - Applications - How they work - Tech Tips - Training - Events